一份简短的TikZ入门介绍
Table of Contents
本文旨在提供一份关于TikZ宏包的简短有效的介绍,该宏包可以在LaTeX中绘制漂亮的图形。希望本文能鼓励读者做更深入的探索。这份文档一定存在着某些问题,如果你发现问题,请给我一封邮件。本问最新文档可以在minimaltikz.pdf 找到。
环境配置
只需要在文章的导言区写入\usepackage{tikz},类似MikTeX的现代\TeX引擎就会自动安装这个宏包。然后,当你想要绘制图形的时候只需要写入:
\begin{tikzpicture}
code
\end{tikzpicture}
如果想要一个浮动体环境,需要写入:
\begin{figure}
\begin{tikzpicture}
code
\end{tikzpicture}
\caption{Do not forget!
    Make it explicit enough that readers
        can figure out what you are doing.}
\end{figure}之后可以使用PDFTEX或者XETEX来编译你的文档。这里还有份更内容更全面的文档,可以在[http://bit.ly/e3eQQd](http://bit.ly/e3eQQd)找到。
完整的示例
%%%%%%%%%%%%%%%%%%%%%%%%%%%%%%%%%%%%%%%%%%%%%%%%%%%%%%%%%%%%%%%%%%%
%%% File          : tikz_e.tex
%%% Author        : xxx-xxxx<xxx-xxxx@xxxx.com>
%%% HomePage      : blog.xxxx.com
%%% Created       : Tue Nov 14 15:53:40 2017
%%% LastModified  : Tue Nov 14 15:53:40 2017
%%% Description   :
%%%
%%% Copyrgiht (c) xxx-xxxx. All rights reserved.
%%%%%%%%%%%%%%%%%%%%%%%%%%%%%%%%%%%%%%%%%%%%%%%%%%%%%%%%%%%%%%%%%%%
\documentclass{article}

\usepackage{tikz}

\begin{document}
\begin{figure}[ht]
  \centering
  \begin{tikzpicture}
    \draw (0, 0) -- (1, 2);
  \end{tikzpicture}
\end{figure}
\end{document}
%%% Local Variables:
%%% mode: latex
%%% coding: utf-8
%%% TeX-master: t
%%% End:
绘制直线和曲线
简单的直线
绘制一条直线的方法就像下面这样
\begin{tikzpicture}
\draw (0,0) --(1,2);
\end{tikzpicture}
编译完成后将得到
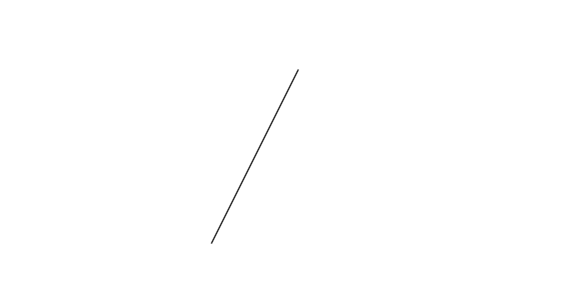
Figure 1: 简单的线段
上面的例子里TikZ将自动绘制一条直线在点(0, 0)和(1, 2)之间,且该直线右边的空白区域被这个图形占有,默认情况下坐标使用的单位是厘米。你可以添加一系列的点到点的线段,例如:
\begin{tikzpicture}
\draw (0,0) --(1,2) -- (2,3) -- (1,0);
\end{tikzpicture}
得到
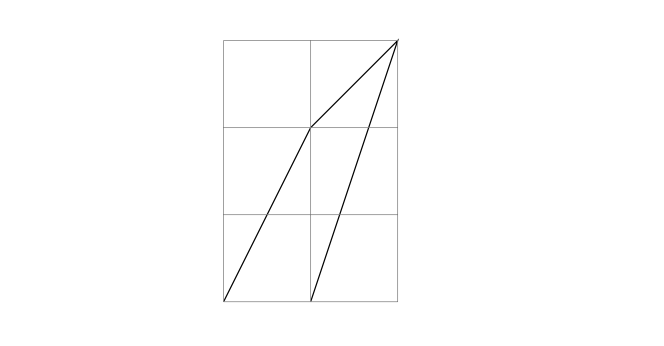
Figure 2: 线段序列
(为了更清楚线段的绘制,上面例子里加上了格子。使用\draw[help lines] (0,0) grid (2,3);,这样将绘制一个从点(0, 0)到点(2, 3)的格子。)当然,也可以添加几条线段在同一个图形上:
\begin{tikzpicture}
\draw (0,0) --(1,2) -- (2,3) -- (1,0);
\draw (3,0) -- (1.5,0.5);
\end{tikzpicture}
得到
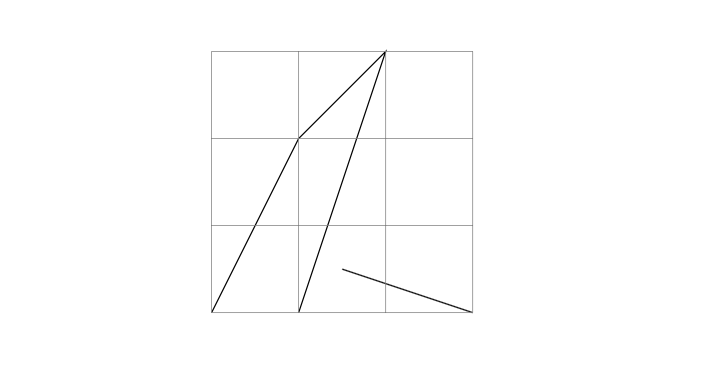
Figure 3: 多条线段
注意每行结束时的分号“;”,它标识着一个规则的结束。将在下面看到一个规则里包含几条线段。同时,也可以在一行中写入几个规则:
\draw (0,0) --(1,2) -- (2,3) -- (1,0); \draw (3,0) -- (1.5,0.5);上面的写法与分开多行写法的输出并没有什么区别。在不改变输出的情况下,可以增加或减少空格,以便提高代码的可读性。
缩放图形
TikZ有个非常有用的特性,可以添加scale选项到环境中,来缩放所绘制的图形。
\begin{figure}[ht]

  \begin{minipage}[t]{.5\linewidth}
    \centering
    \begin{tikzpicture}[scale=3]
      \draw (0,0) -- (1,1);
    \end{tikzpicture}
    \caption{缩放的图形}
  \end{minipage}

  \begin{minipage}[t]{.5\linewidth}
    \centering
    \begin{tikzpicture}
      \draw (0,0) -- (1,1);
    \end{tikzpicture}
    \caption{未缩放的图形}
  \end{minipage}

\end{figure}
得到
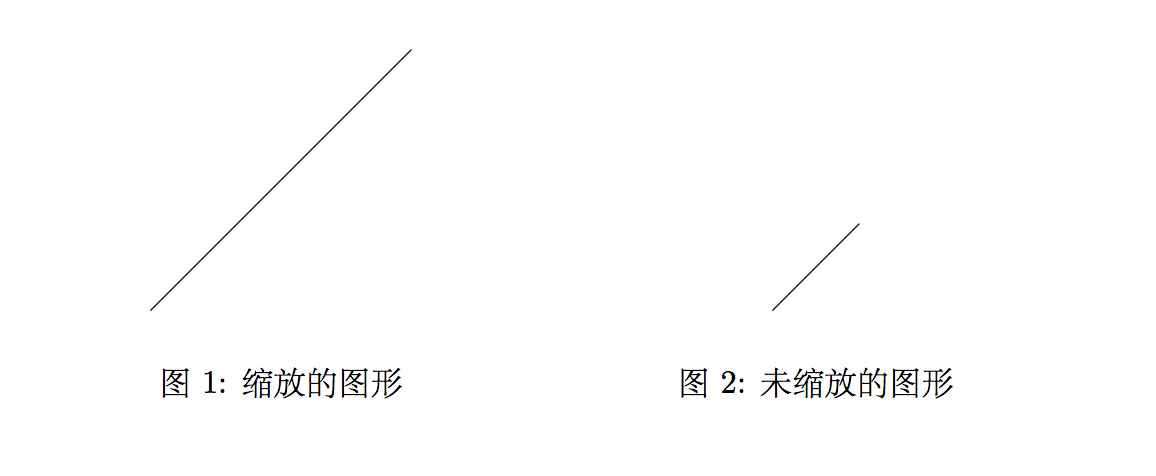
Figure 4: 缩放图形
还可以向一个指定的方向缩放:
\begin{figure}[ht]

  \begin{minipage}[t]{.5\linewidth}
    \centering
    \begin{tikzpicture}[xscale=3]
      \draw (0,0) -- (1,1);
    \end{tikzpicture}
    \caption{沿X轴缩放}
  \end{minipage}

  \begin{minipage}[t]{.5\linewidth}
    \centering
    \begin{tikzpicture}[xscale=2.5, yscale=0.5]
      \draw (0,0) -- (1,1);
    \end{tikzpicture}
    \caption{沿X和Y轴缩放}
  \end{minipage}

\end{figure}
得到
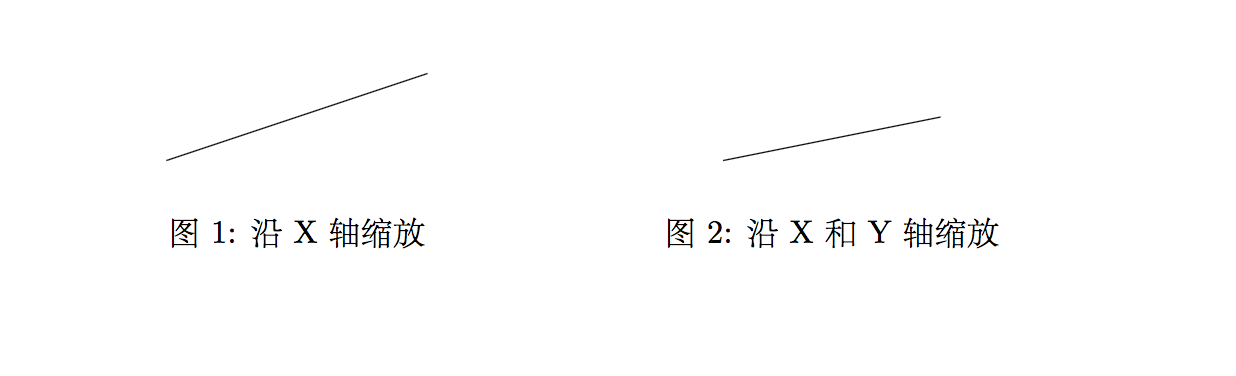
Figure 5: 沿某方向缩放
箭头及其相关图形
在绘制线段的时候,可以绘制的线段带上一些装饰。比如,可以在线段两端放置箭头或者竖线。
\begin{tikzpicture}
\draw [->] (0,0) -- (2,0);
\draw [<-] (0, -0.5) -- (2,-0.5);
\draw [|->] (0,-1) -- (2,-1);
\end{tikzpicture}
得到
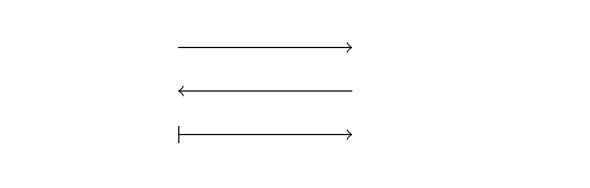
Figure 6: 装饰的线段
给线段两端添加箭头也是极方便的
\begin{tikzpicture}
\draw [<->] (0,2) -- (0,0) -- (3,0);
\end{tikzpicture}
得到
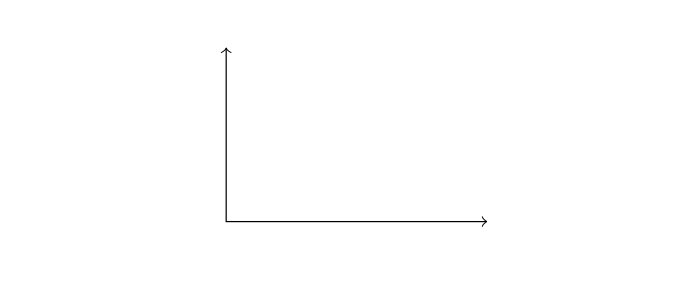
Figure 7: 两端带有箭头的图形
改变线段的粗细
还可以通过改变粗细来装饰线段
\begin{tikzpicture}
\draw [ultra thick] (0,1) -- (2,1);
\draw [thick] (0,0.5) -- (2,0.5);
\draw [thin] (0,0) -- (2,0);
\end{tikzpicture}
得到
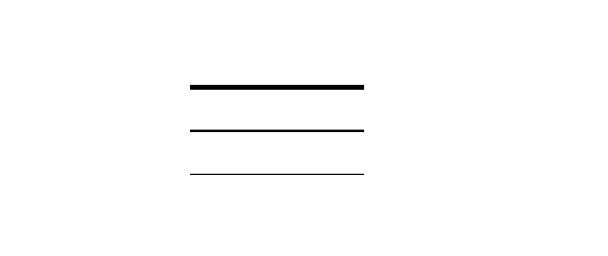
Figure 8: 改变粗细的线段
可以使用的\draw命令选项还有:ultra thin very thin thin semithick thick very thick ultra thick 这里再一次看一看help lines,它显示为灰色的细线为特别的某个点提供焦点
\begin{tikzpicture}
\draw [<->] (0,2) -- (0,0) -- (4,0);
 \draw [thick] (0,1.5) -- (3,0);
\draw [ultra thick] (0,0) -- (2,2);
\draw [help lines] (1,0) -- (1,1) -- (0,1);
\end{tikzpicture}
显示为
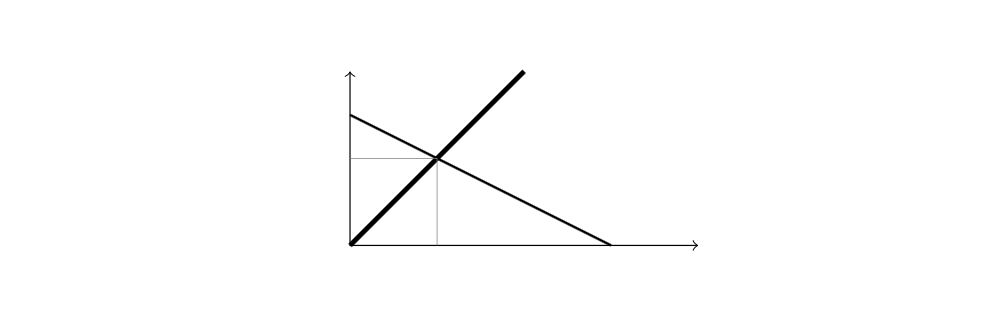
Figure 9: Help lines
还可以指定线的宽度
\begin{tikzpicture}
\draw [line width=12] (0,0) -- (2,0);
\draw [line width=0.2cm] (4,.75) -- (5,.25);
\end{tikzpicture}
显示为
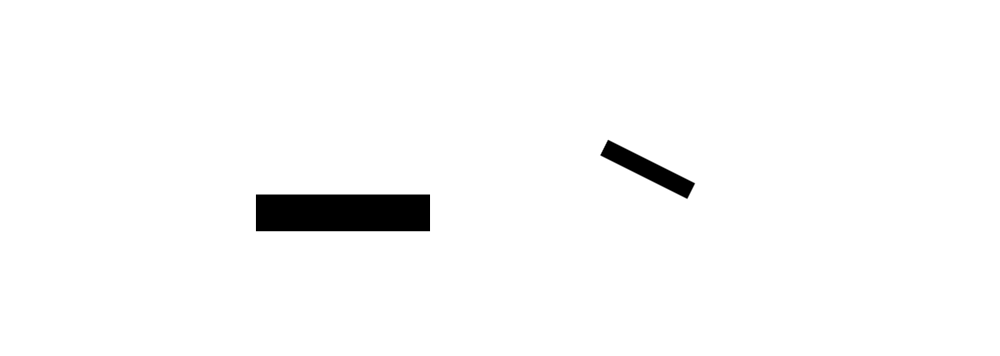
Figure 10: Lines Width
虚线和点
\draw命令还可以画出点和破折号
\begin{tikzpicture}
\draw [dashed, ultra thick] (0,1) -- (2,1);
\draw [dashed] (0, 0.5) -- (2,0.5);
\draw [dotted] (0,0) -- (2,0);
\end{tikzpicture}
显示为

Figure 11: 破折号和点
第一行的绘制命令说明了一个绘制命令中可以混合多种装饰。还有很多控制选项用以装饰点和虚线,参见手册。
颜色
最后,还可以在给线段装饰上颜色
\begin{tikzpicture}
\draw [gray] (0,1) -- (2,1);
\draw [red] (0, 0.5) -- (2,0.5);
\draw [blue] (0,0) -- (2,0);
\end{tikzpicture}
显示为

Figure 12: 带颜色的线
关于颜色的值,可以直接使用red green blue cyan magenta yellow black gray darkgray lightgray brown lime olive orange pink purple teal violet white。并且还可以定义一切想要的颜色,参见手册。
行内图形
你可能想知道怎样才能将图形包含在一行中。TikZ做到这样的效果只需要写入
wherever \begin{tikzpicture} \draw [yellow, line width=6] (0,0) -- (.5,0); \end{tikzpicture} you want显示为

Figure 13: 行内图形
TikZ中实现这种效果还有个\tikz命令可用,参见手册。
曲线
不仅仅是绘制直线
\begin{tikzpicture}
\draw [blue] (0,0) rectangle (1.5,1);
\draw [red, ultra thick] (3,0.5) circle [radius=0.5];;
\draw [gray] (6,0) arc [radius=1, start angle=45, end angle= 120];
\end{tikzpicture}
显示为
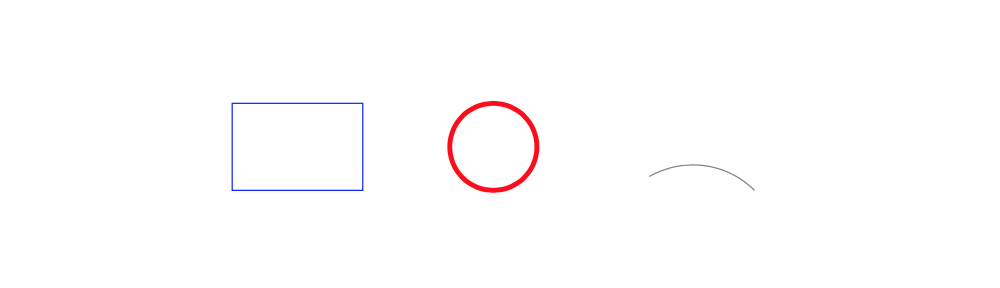
Figure 14: 曲线
图中的弧形的半径是1,弧形开始与点(6, 0)接着顺着45度角停止在当它120度的时候。你可以绘制一个路径让它平滑的转动
\begin{tikzpicture}
\draw [<->, rounded corners, thick, purple] (0,2) -- (0,0) -- (3,0);
\end{tikzpicture}
显示为

Figure 15: 平滑转动的线条
如果想要明确的指定一条曲线的路径,可以使用类似Mathematica的程序计算出路径所经的所有点的位置,然后把它们写入TikZ
\begin{tikzpicture}[xscale=25,yscale=5]
\draw [<->, help lines] (0.6,1.34) -- (0.6,1) -- (1.05,1);
\draw[orange] (0.6, 1.0385) --
(0.61, 1.06372) -- (0.62, 1.08756) -- (0.63, 1.11012) -- (0.64,
1.13147) -- (0.65, 1.15166) -- (0.66, 1.17074) -- (0.67, 1.18874) -- (0.68,
1.20568) -- (0.69, 1.22157) -- (0.7, 1.23643) -- (0.71, 1.25026) -- (0.72,
1.26307) -- (0.73, 1.27486) -- (0.74, 1.28561) -- (0.75, 1.29534) -- (0.76,
1.30402) -- (0.77, 1.31165) -- (0.78, 1.31821) -- (0.79, 1.32369) -- (0.8,
1.32806) -- (0.81, 1.33131) -- (0.82, 1.3334) -- (0.83, 1.33431) -- (0.84,
1.334) -- (0.85, 1.33244) -- (0.86, 1.32956) -- (0.87, 1.32533) -- (0.88,
1.31966) -- (0.89, 1.3125) -- (0.9, 1.30373) -- (0.91, 1.29325) -- (0.92,
1.2809) -- (0.93, 1.26649) -- (0.94, 1.24976) -- (0.95, 1.23032) -- (0.96,
1.2076) -- (0.97, 1.18065) -- (0.98, 1.14763) -- (0.99, 1.1038) -- (0.991,
1.09836) -- (0.992, 1.09261) -- (0.993, 1.0865) -- (0.994, 1.07994) -- (0.995,
1.07282) -- (0.996, 1.06497) -- (0.997, 1.0561) -- (0.998, 1.04563) -- (0.999,
1.03209) -- (0.9991, 1.03042) -- (0.9992, 1.02866) -- (0.9993,
1.02679) -- (0.9994, 1.02478) -- (0.9995, 1.0226) -- (0.9996, 1.02019) -- (0.9997,
1.01747) -- (0.9998, 1.01424) -- (0.9999, 1.01005) -- (0.9999,
1.01005) -- (0.99991, 1.00953) -- (0.99992, 1.00898) -- (0.99993,
1.0084) -- (0.99994, 1.00778) -- (0.99995, 1.0071) -- (0.99996,
1.00634) -- (0.99997, 1.00549) -- (0.99998, 1.00448) -- (0.99999, 1.00317) -- (1,
1) ;
\end{tikzpicture}
显示为
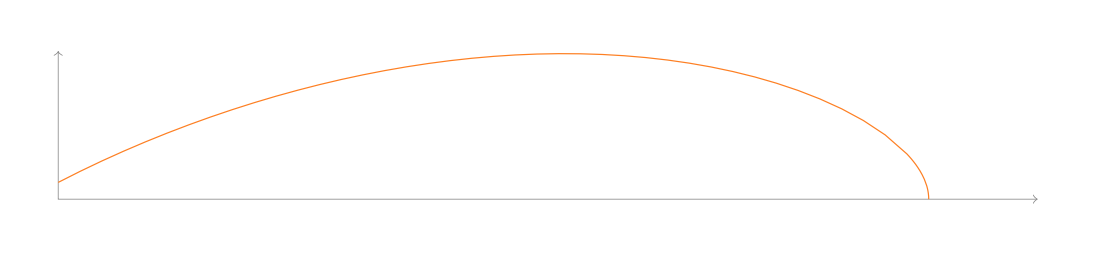
Figure 16: 指定路径的曲线
这里有两点需要注意的
- 这样做过于繁琐,不需要这么多的点位
- This can also serve as a reminder that one TikZ instruction can be spread over several lines and cut arbitrarily over several lines. The marker is the semi-colon, not the end of line!
还有几种方式可以不使用所有的点位来绘制曲线,比如
\begin{tikzpicture}
\draw[very thick] (0,0) to [out=90,in=195] (2,1.5);
\end{tikzpicture}
这样就给出了一条曲线,从点(0, 0)到点(2, 1.5),它开始于一个90度角到达一个195度角
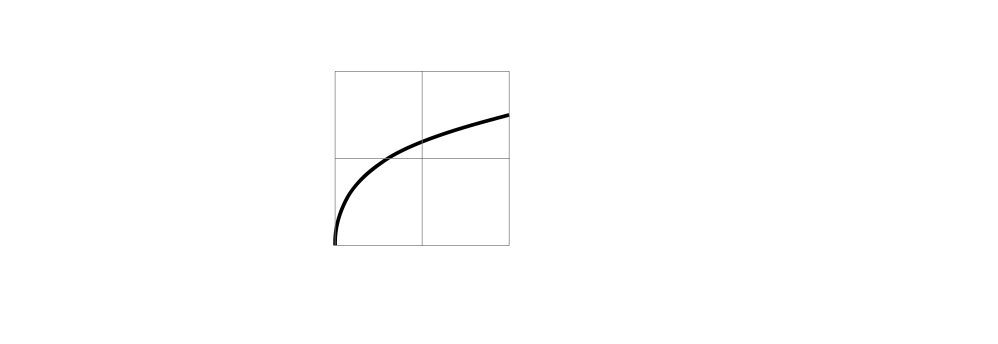
Figure 17: 简单的方式绘制曲线
注意看一下这个角是如何运作的
- When the curves goes “out” of (0,0), you put a needle with one extremity on the starting point and the other one facing right and you turn it coun- terclockwise until it is tangent to the curve. The angle by which you have to turn the needle gives you the “out” angle.
- When the curves goes “in” at (2,1.5), you put a needle with one extremity on the arrival point and the other one facing right and you turn it coun- terclockwise until it is tangent to the curve. The angle by which you have to turn the needle gives you the “in” angle.
就像直线一样,我们可以使用几个to结构在同样的TikZ结构中
\begin{tikzpicture}
\draw [<->,thick, cyan] (0,0) to [out=90,in=180] (1,1)
        to [out=0,in=180] (2.5,0) to [out=0,in=-135] (4,1) ;
\end{tikzpicture}
显示为

注意,这里的曲线我们同样可以给它添加上箭头装饰。它们放置于第一个末端部分和最后一个末端部分。如果想要所有部分都带有箭头,you have to build the curve from individual components.
Plotting functions
当然TikZ也有数学计算引擎提供绘制功能
\begin{tikzpicture}[xscale=13,yscale=3.8]
\draw [<->] (0,0.8) -- (0,0) -- (0.5,0);
\draw[green, ultra thick, domain=0:0.5] plot (\x, {0.025+\x+\x*\x});
\end{tikzpicture}
显示为
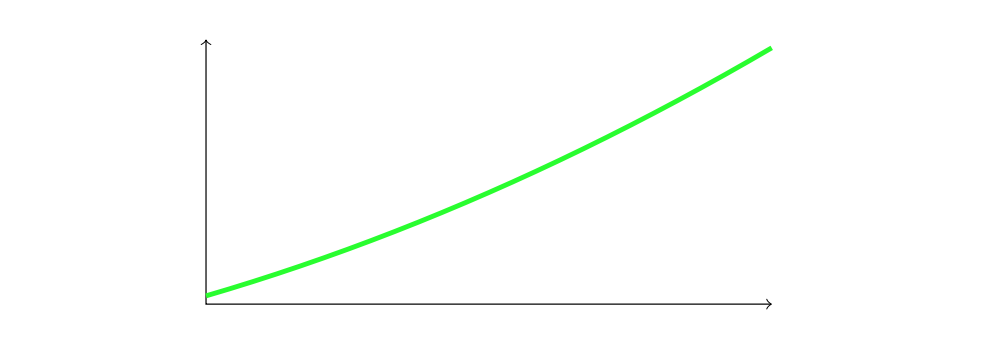
domain指令描述了绘制x的范围
-— 《A very minimal introduction to TikZ\*》P_11 未完待续